Ciclos Estacionales
Variable
Medición
Variable
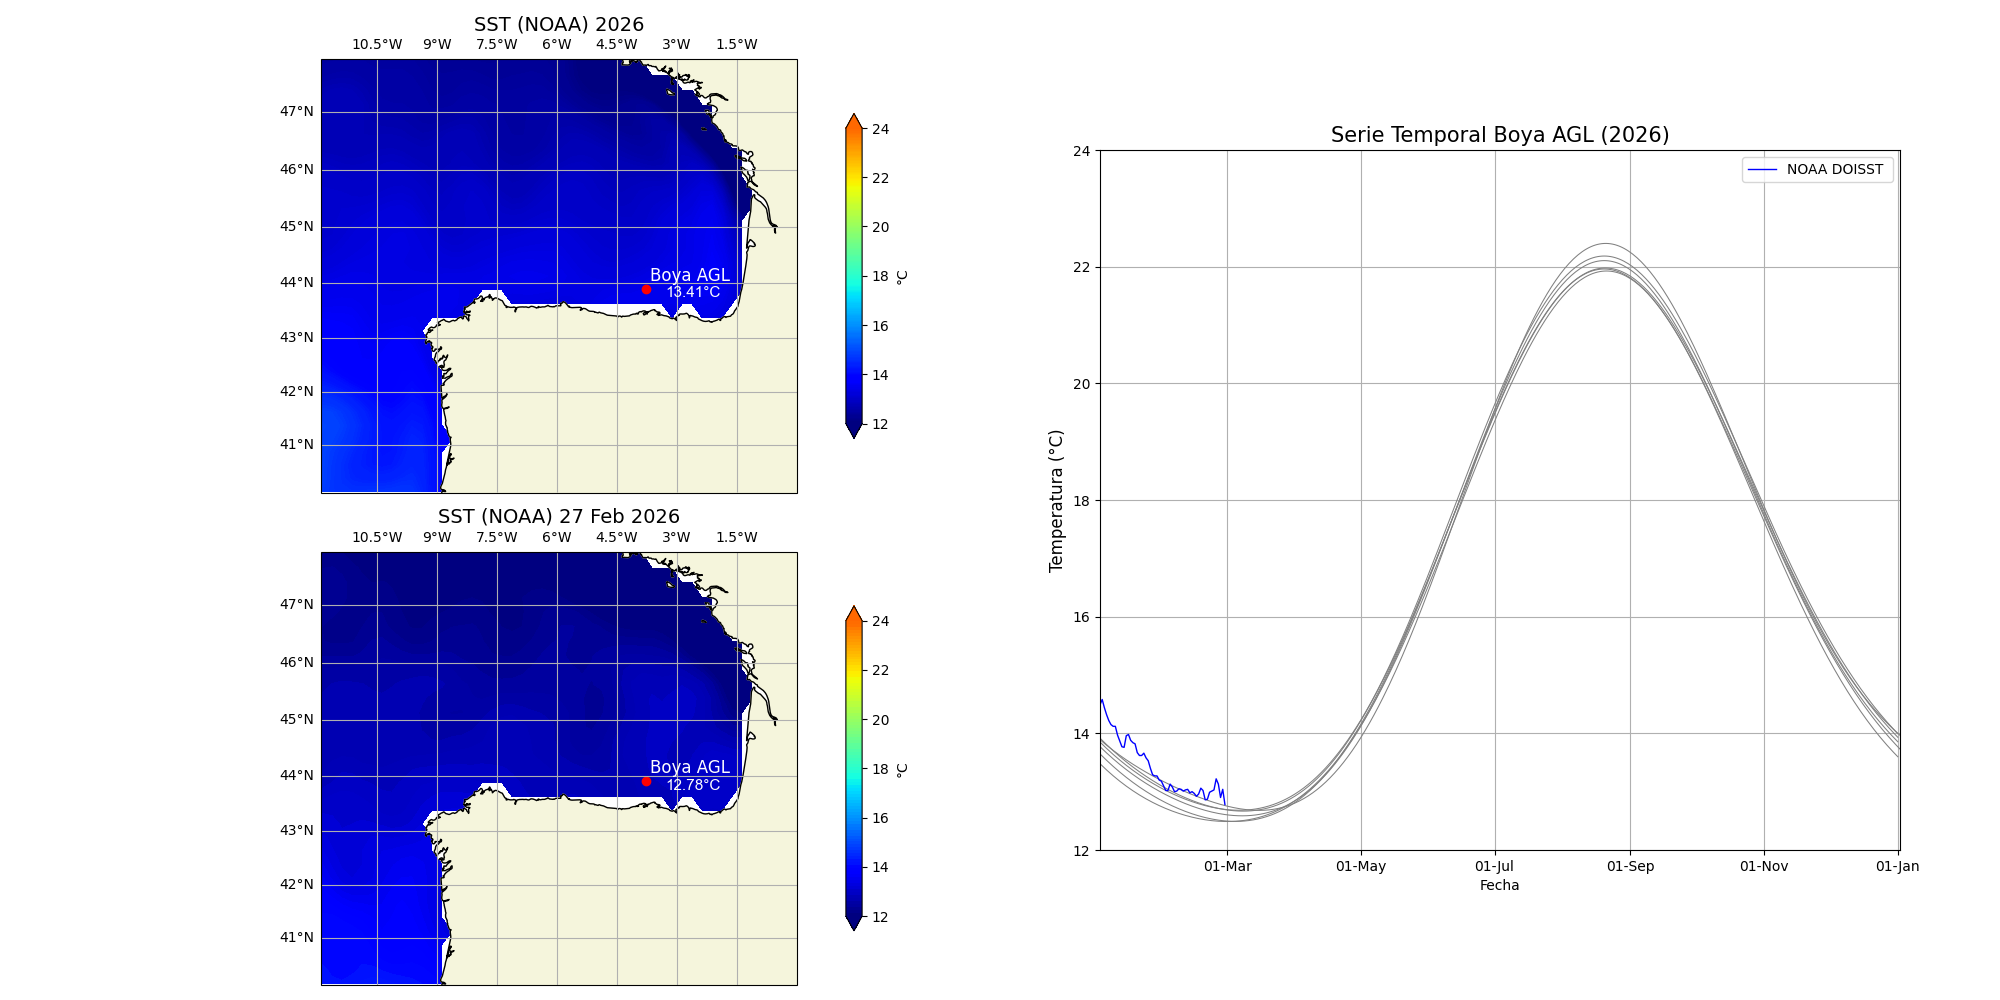
SST – Sea Surface Temperature
Medición
Variable
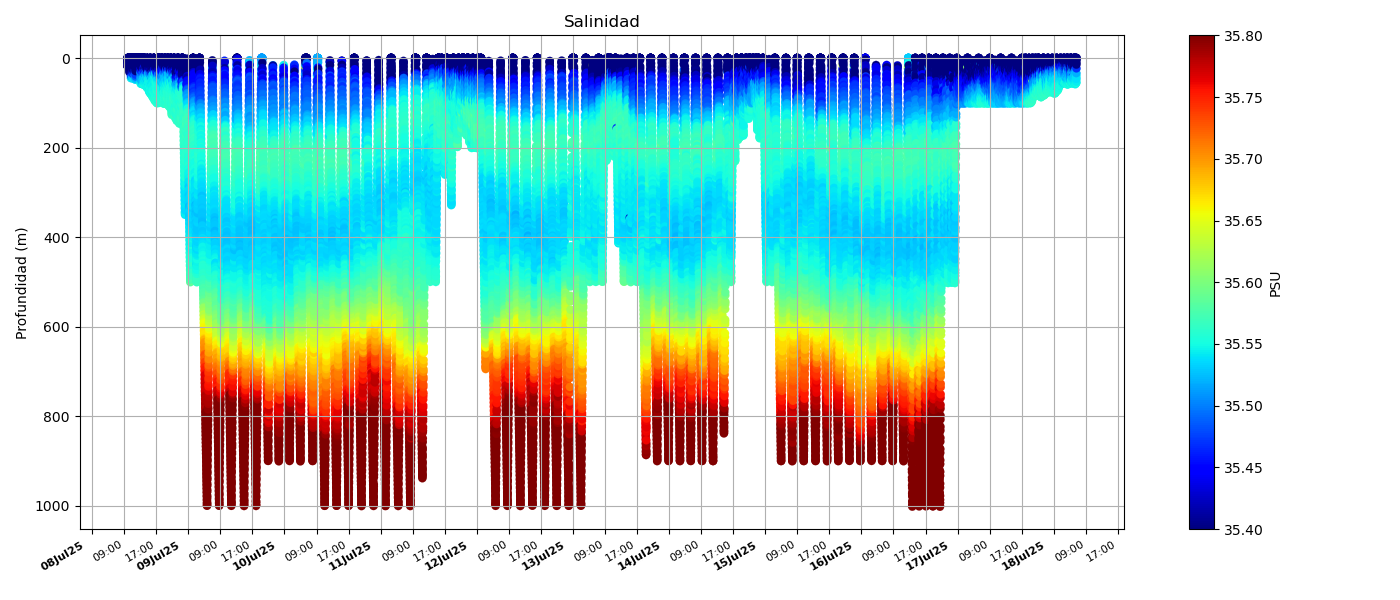
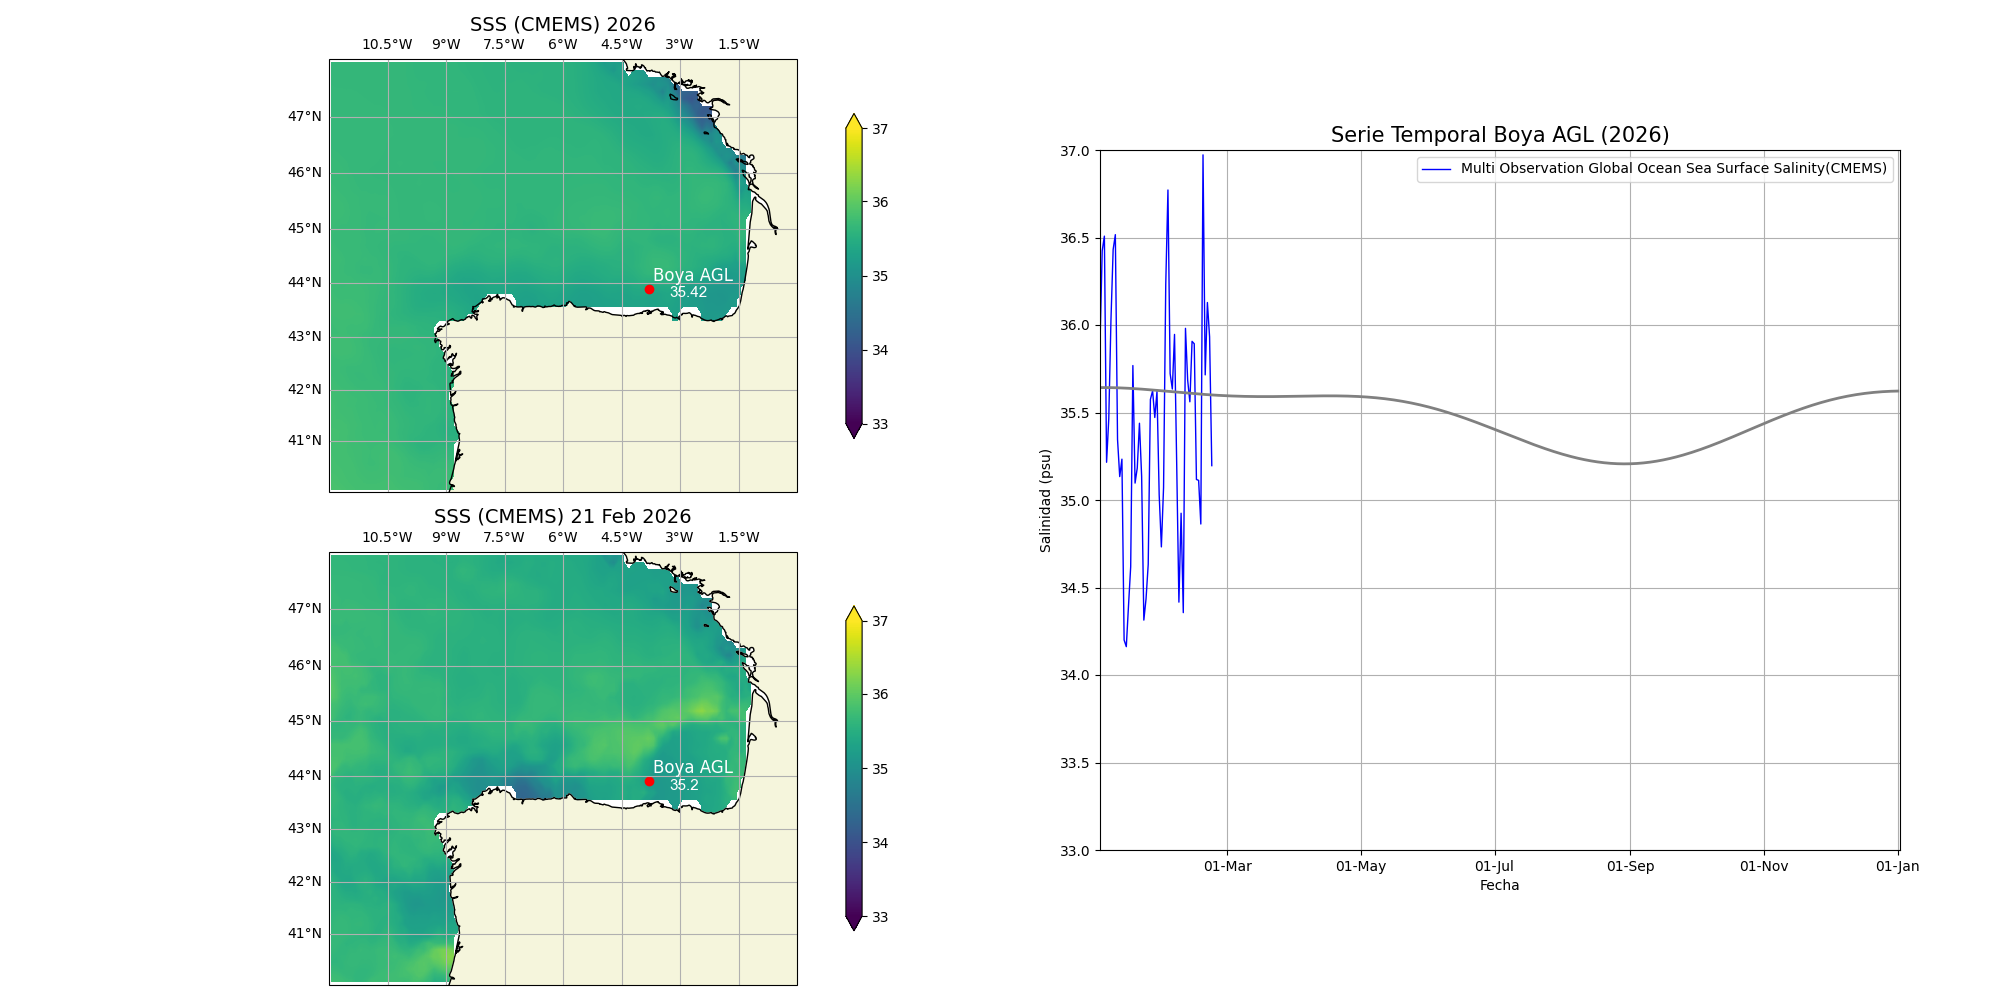
SSS – Sea Surface Salinity
Medición
Variable
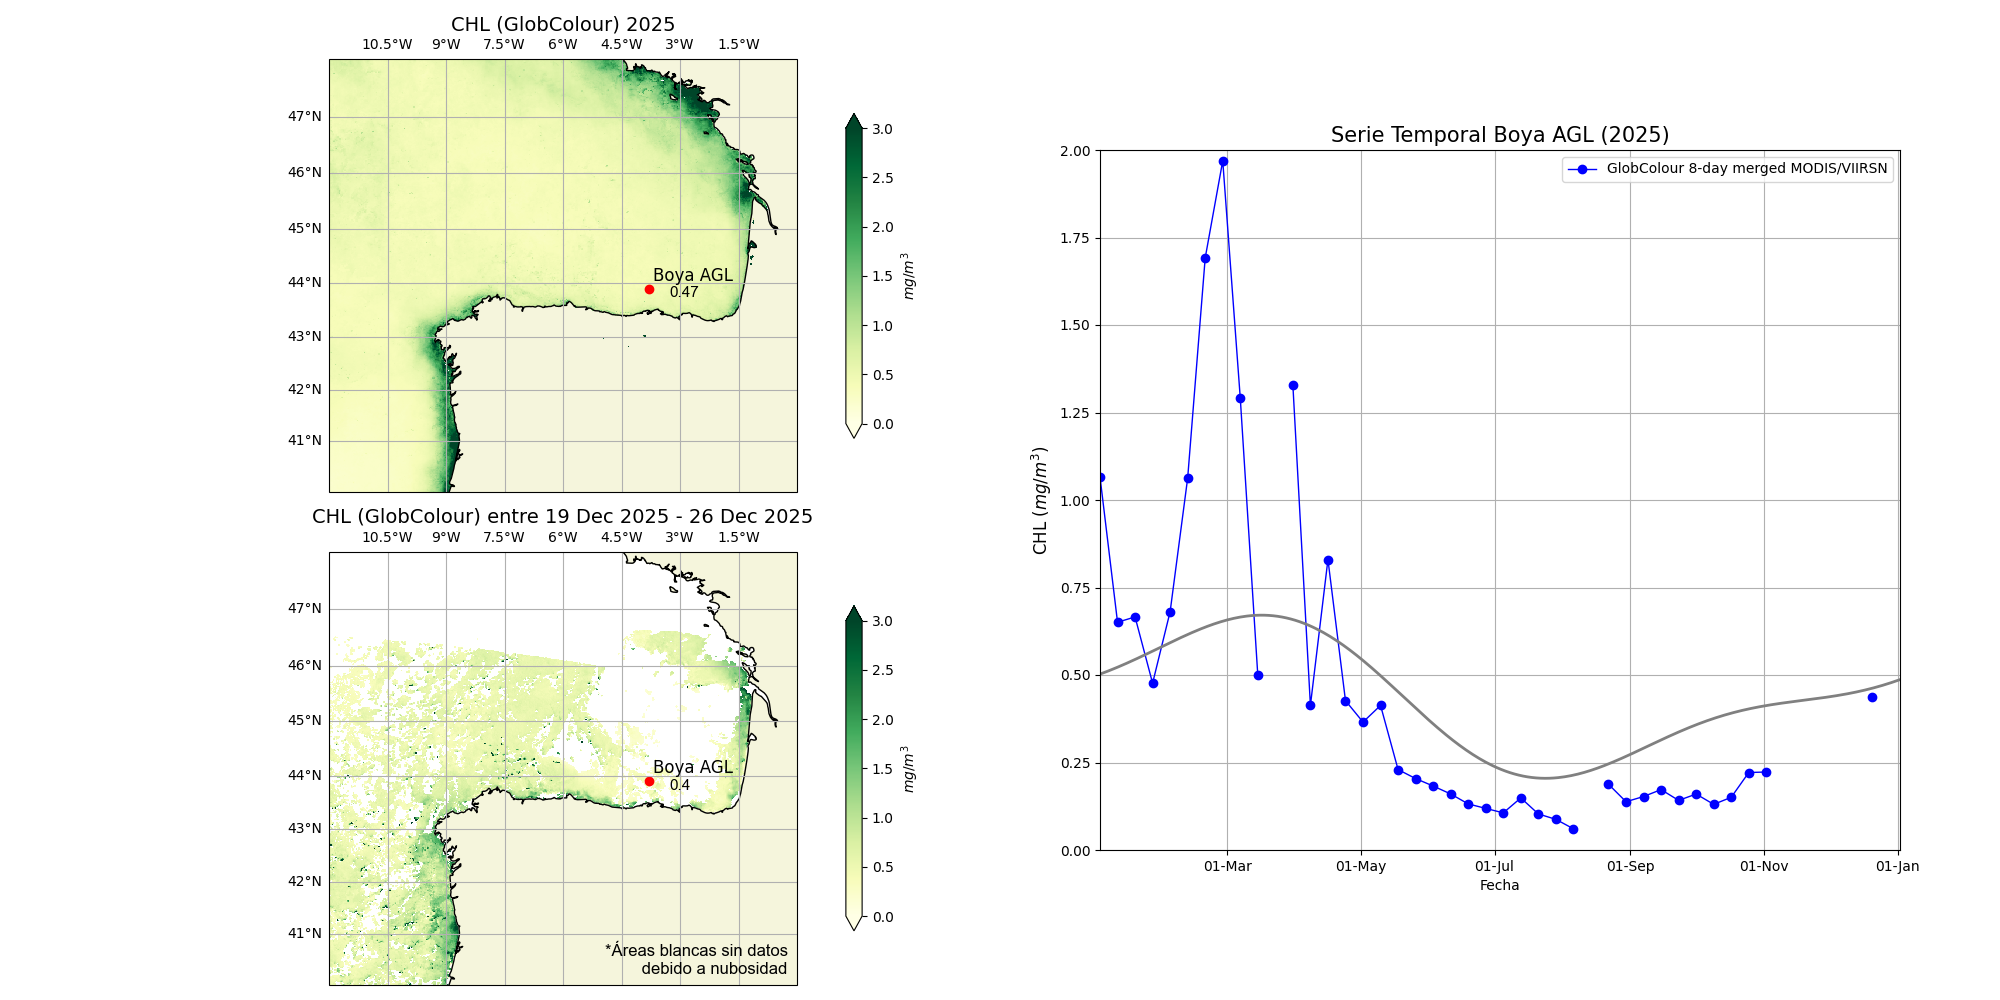
Chlorophyll
Medición
MLD y Estratificación
Variable
Medición
Variable
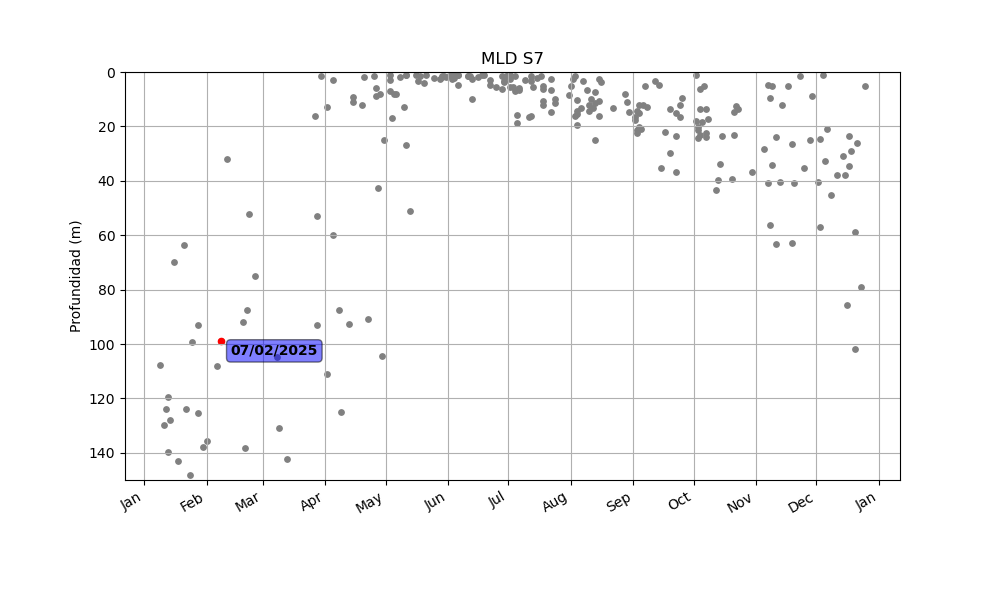
MLD – Mixed Layer Depth
Medición
Oxígeno
Variable
Medición
Variable
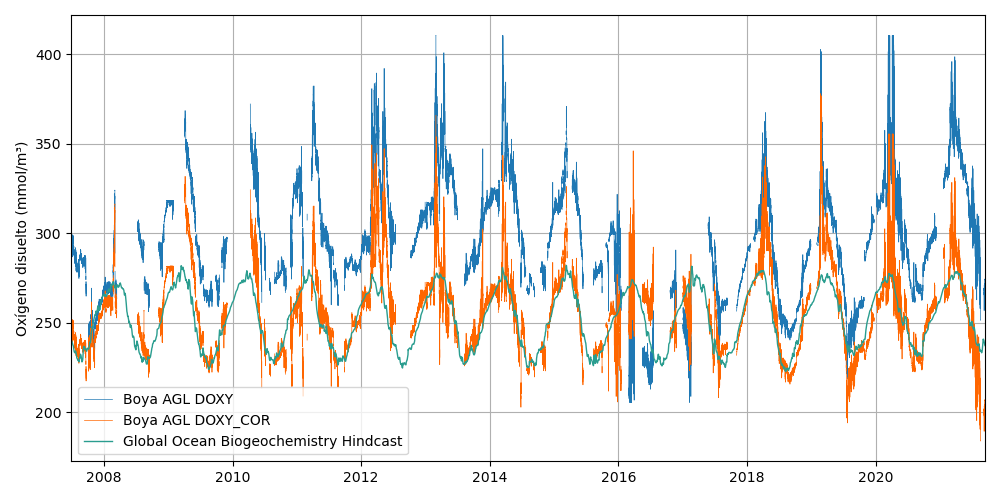
Dissolved Oxygen
Medición
Calor y sal
Variable
Medición
Variable
Temperature (Heat Content)
Medición
Variable
Salinity (Salt Content)
Medición