The Santander Atlantic Time Series (SATS) integrates data from both the Augusto González de Linares (AGL) buoy and its associated oceanographic station, which is sampled regularly during the RADiales del CANtábrico (RADCAN) campaigns. Together, these sustained observations provide a comprehensive record of meteorological, oceanographic, and biogeochemical variables, offering a complete view of ocean processes — from the seafloor to the atmosphere — at a representative mid-latitude location in the eastern North Atlantic.
The SATS oceanographic station, located at the deepest point of the Santander Radial, reaches depths exceeding 2,500 meters. It forms a core part of the SATS observatory, serving as a crucial reference site for long-term ocean monitoring. The Santander standard section was established in the early 1990s as part of the Spanish Institute of Oceanography’s (IEO) Radiales program — a national effort to build long-term oceanographic time series across Spanish waters. Since then, these Radiales have become internationally recognized for their contribution to climate and ocean research, providing reliable baselines and trend data at both local and regional scales across multiple oceanic provinces.
Discover our scientific projects and publications.
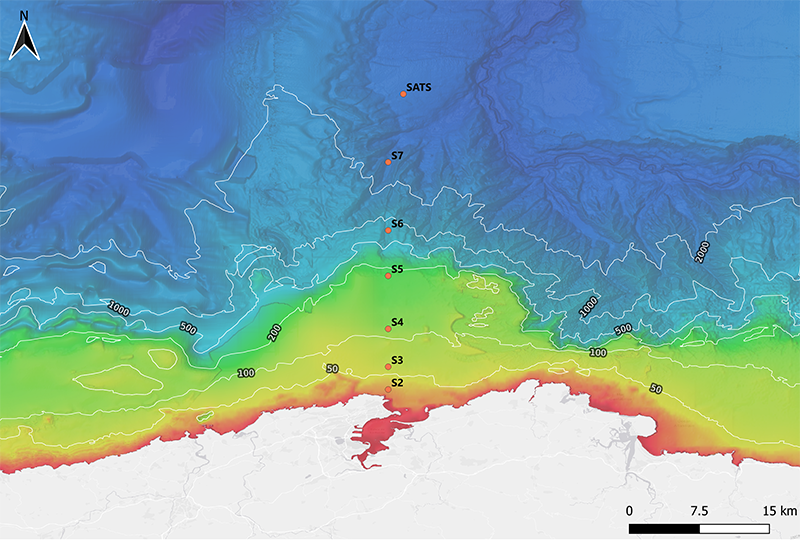
The Santander standard section sampling program was originally designed for day-long coastal surveys carried out with small research vessels. As a result, its initial focus was primarily on the continental shelf. However, thanks to the close proximity of the continental slope off Santander (in the southeastern Bay of Biscay), monthly sampling extending into mid-waters became possible as early as the 1990s at the outermost stations. Sampling was limited to 1000 meters until the end of 2007, then it was extended to 1500 and since 2014, after the construction of a larger regional vessel that is in charge of sampling, it covers the total depth of 2500 m. The deep station (S7), which is regularly sampled from the surface to the seafloor, forms the core oceanographic station of the SATS observatory — providing continuous, high-quality data from the upper ocean to ocean floor.